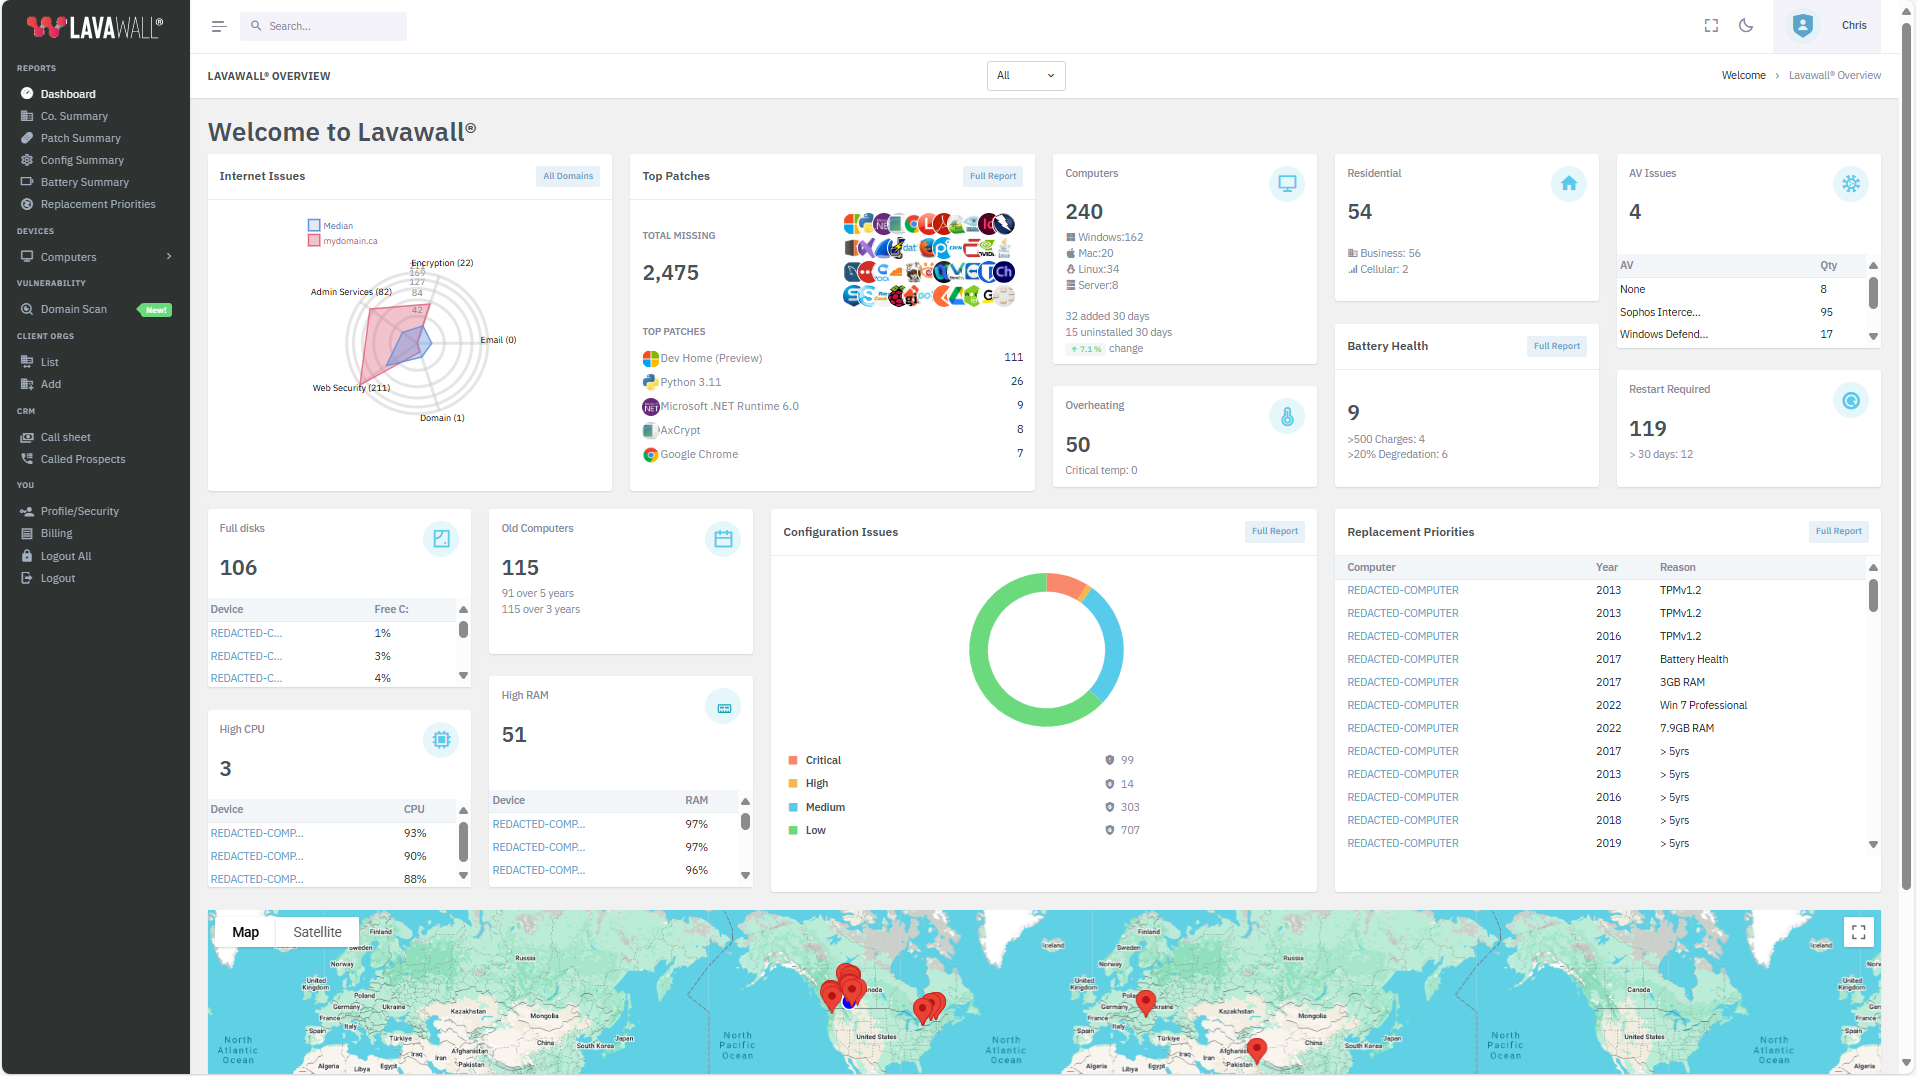
- Your most vulnerable domain
- The most common updates missing in your organization
- Total computer count
- Number of Windows computers
- Number of Mac computers
- Number of Linux computers
- Number of servers
- Number of computers added in the last 30 days
- Number of computers removed in the last 30 days
- Percentage changed
- Number of overheating computers
- Computers with critically-high temperatures
- Number of computers by network type (residential, business, cellular, plane, travelling, college, school, government, and more)
- Antivirus issues
- Number of computers using each antivirus vendor
- Computers waiting for a restart
- Computers that haven’t restarted for over 30 days
- Computers with full hard drives
- Old computers that need to be prioritized for replacement
- Computers with high CPU utilization
- Computers with high RAM utilization
- Number of configuration issues with risk priotization
- Computers that should be replaced and why (outdated Trusted Platform Module (TPM), battery health, low available RAM, old OS, age, hard drive health, etc)
- A map of the approximate location of the computers you’re managing with the ability to quickly show their details and Internet Service Provider (ISP) information
If you have any questions or need further assistance, feel free to reach out through our chat, phone or email on our contact page!