Technician checklists
The routines your team actually wants to use.
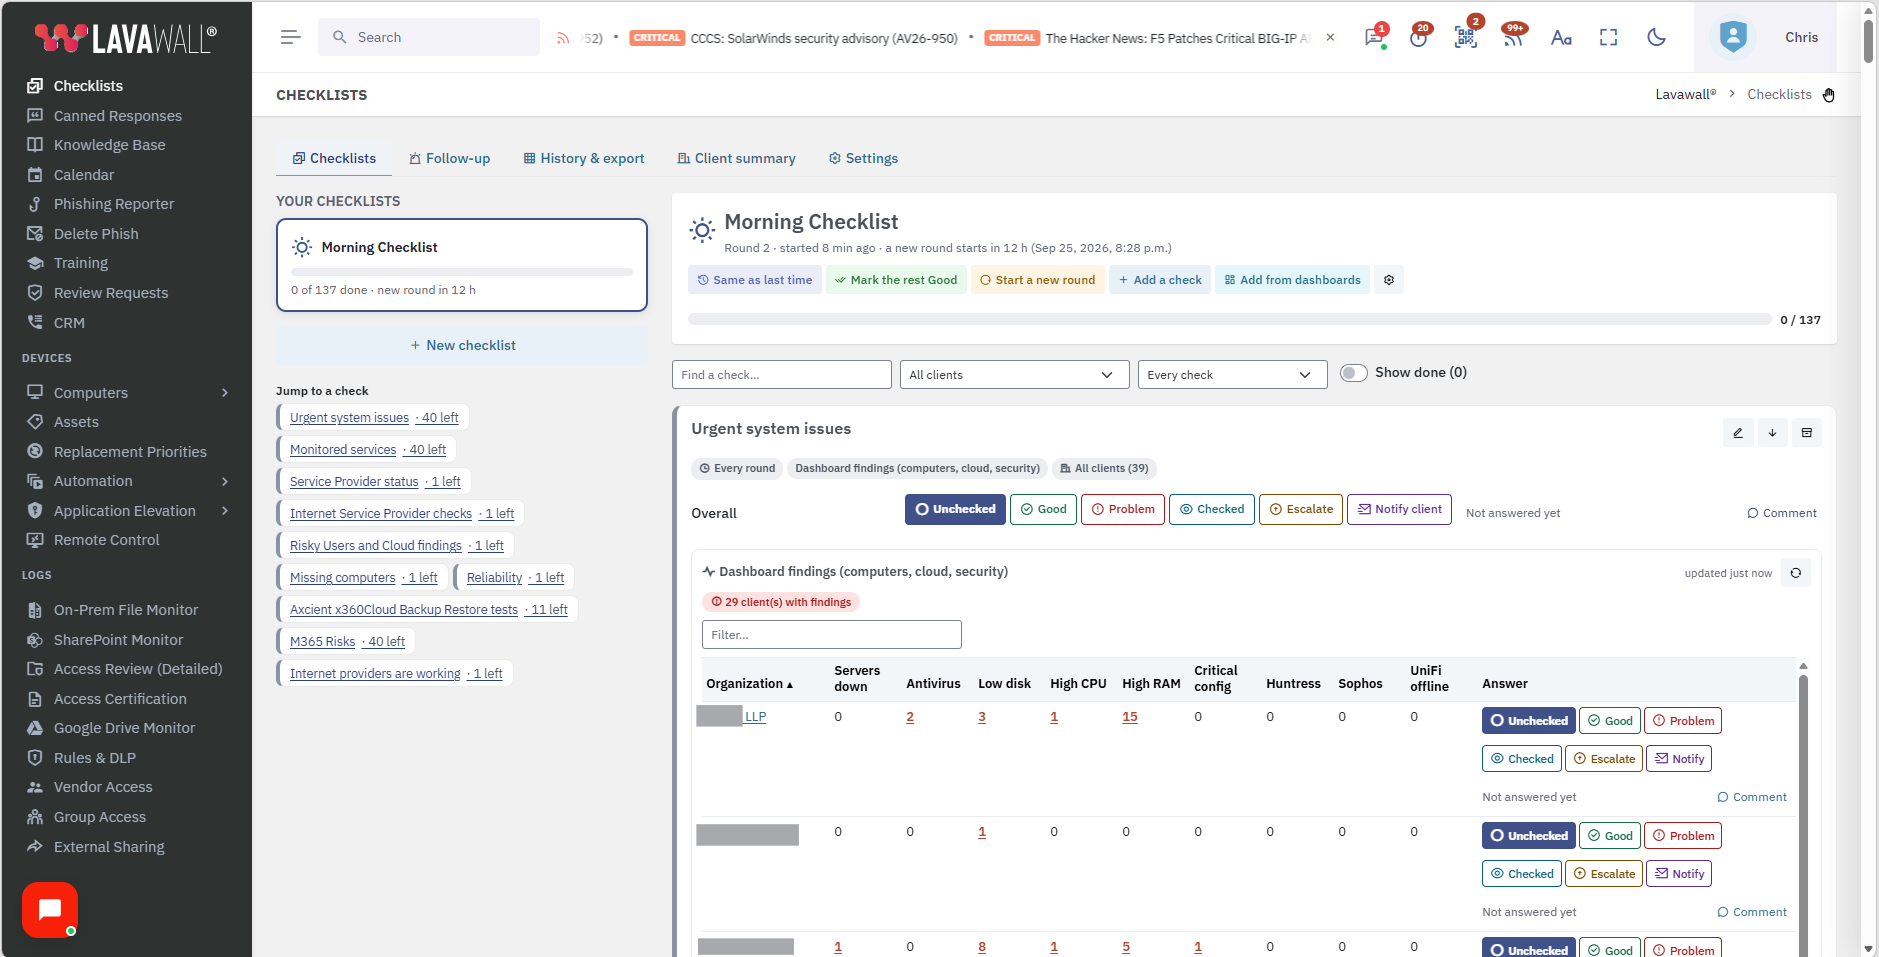
One shared place for your team's daily, weekly, and monthly routines, built so technicians feel in control rather than buried in busywork. The checks read live data from the same platform that runs your RMM and cloud monitoring, and every answer becomes part of your record.
Part of the platform, not a separate tool
A checklist in a document cannot see your fleet, so someone has to go and look. Lavawall® checklists live in the same console as your RMM, cloud and network monitoring, and GRC, so each check already knows the answer. A morning routine shows which clients have a server down or a Microsoft 365 risk before anyone opens a ticket, and every answer, escalation, and note is kept as part of the record your audit relies on.
Built for the way a team actually works
Fewer clicks, clear history, and nothing lost between rounds.
Your checklists, your way
Build as many as you need, such as morning, evening, weekly, and monthly. Write instructions with formatting and images, and embed a vendor's web page right in a check.
Clear answers, full history
Every check is answered Good, Problem, Checked, Escalate, or Notify client. Each answer records who gave it and when, with comments under each check.
One check, many clients
Give each client its own answer, or cover everyone with one. Choose all clients and new ones are included automatically, with inactive clients and prospects left out.
Only what's due
Set checks to repeat hourly, daily, weekly, monthly, or yearly. Recently answered checks are hidden until due, and an early window lets the team get ahead.
Less clicking
Answer every client at once, repeat last round's Good answers in one step, answer straight from the live data table, or show only clients with problems and mark the rest Good automatically.
Nothing falls through the cracks
Escalations and notify-client items collect in a follow-up view until someone marks them done.
Live data in every check
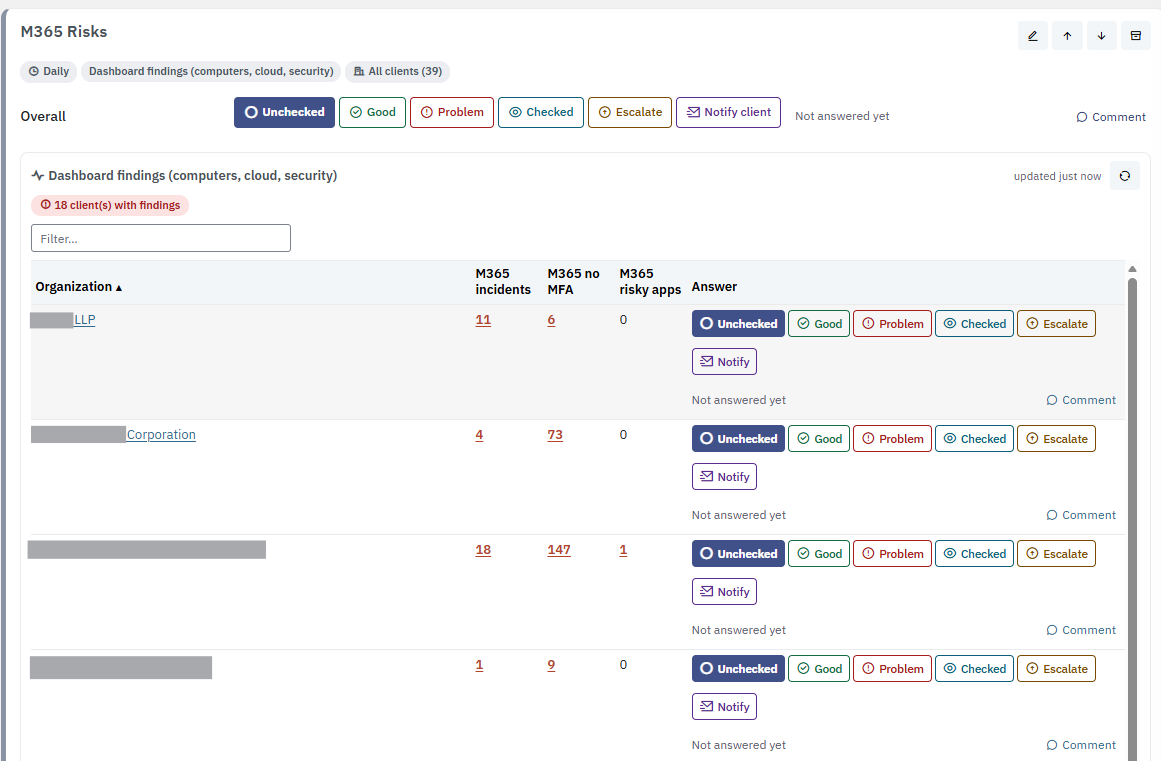
Attach live information to a check and it shows the current state per client, so the routine is a decision, not a data-gathering chore. Each number links straight to the detail, and a client with nothing wrong can be set to Good automatically, with a note recording why.
Monitored services
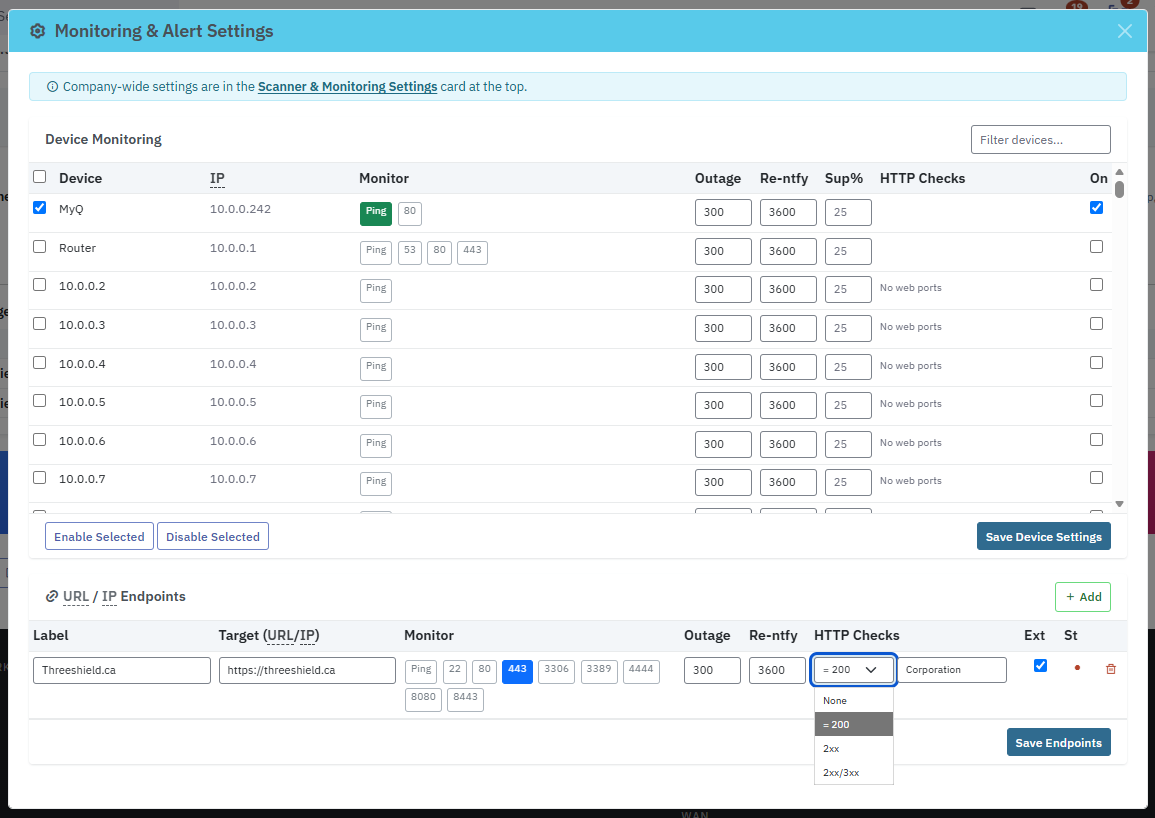
See which clients have a service down, and jump straight to that client's monitoring settings.
Dashboard findings
Computers not seen for 7, 30, or 90 days, antivirus, patches, low disk, Microsoft 365 and Google Workspace risks, security alerts, and more.
Service provider status
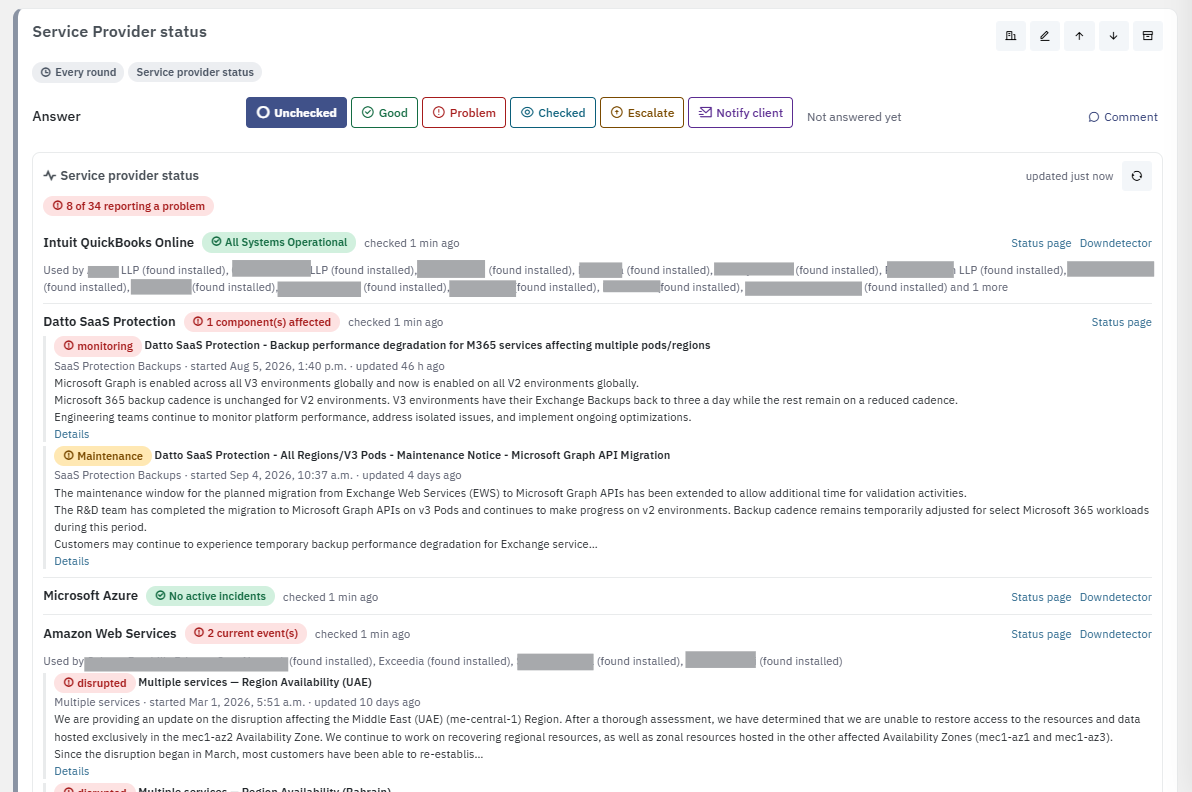
Live status and incidents from more than 50 services MSPs rely on, including Microsoft 365, Google Workspace, AWS, Azure, Google Cloud, Cloudflare, Datto, Kaseya, ConnectWise, N-able, NinjaOne, Sophos, Huntress, SentinelOne, UniFi, and QuickBooks. The providers your clients use are detected automatically, and you can add any other.
Internet providers
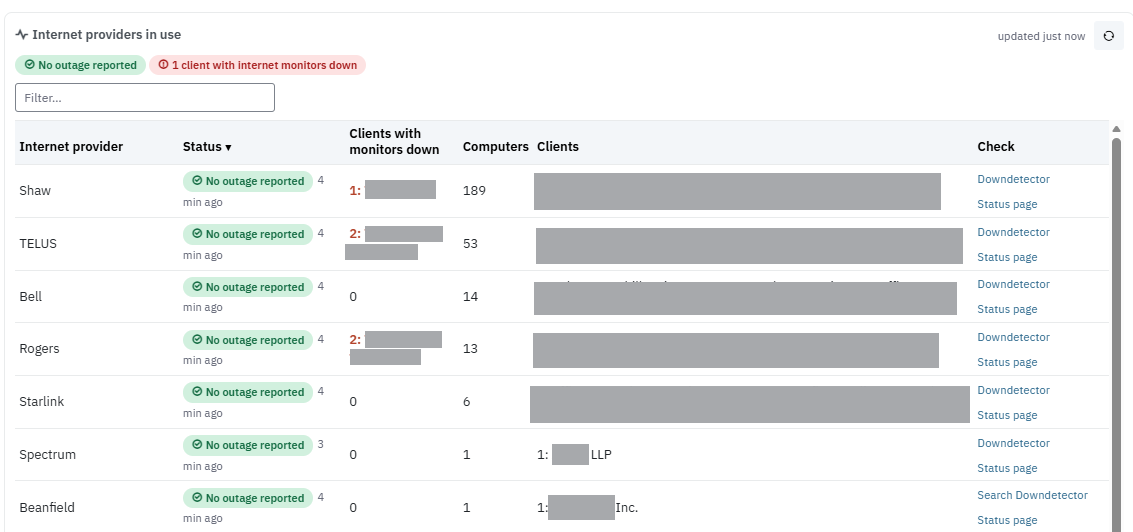
Lavawall® automatically detects the internet providers your clients' computers actually use, and shows each one's outage status. See which clients are affected, and get a flag when several clients on the same ISP drop together. Downdetector and Cloudflare Radar links are included for a quick second look.
Add a check in seconds
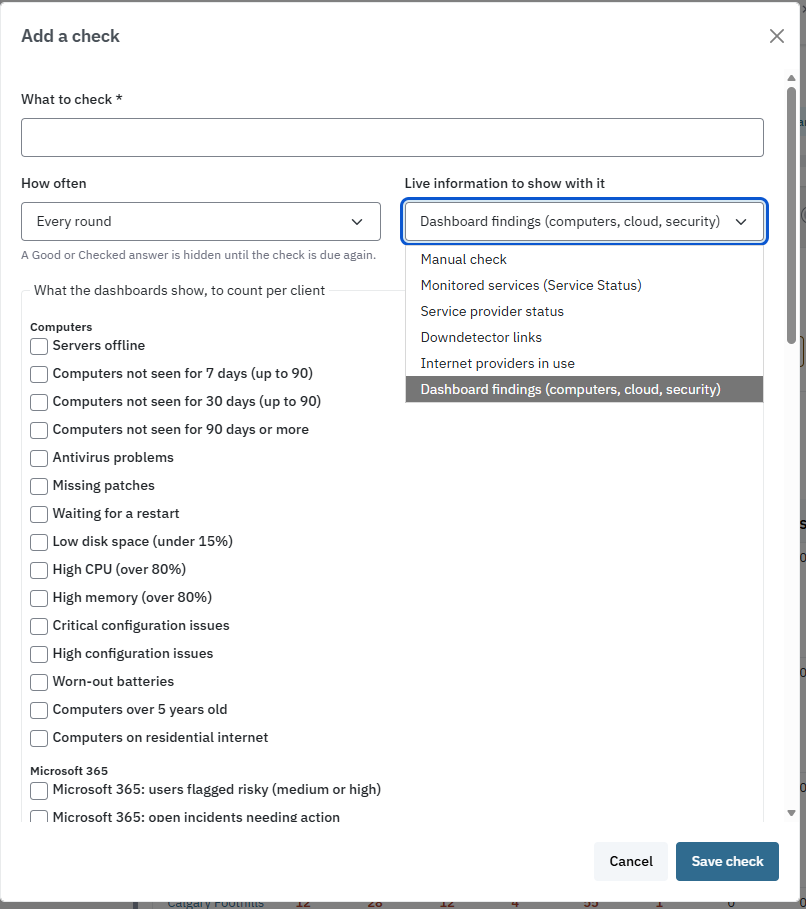
Name the check, choose how often it repeats, and attach the live data to show with it. A Good or Checked answer stays hidden until the check is due again, so the list only shows what needs attention.
Because the data comes from the same agent that patches and monitors the endpoint, there is no separate integration to wire up.
Outage alerts, and a status page your clients can see
Get notified when a provider or ISP you or your clients use reports an outage. The clients who use that provider are named in the alert, and it closes on its own when the problem is resolved. You choose per provider whether alerts are automatic, always, or never. Because the providers are detected from your clients' own computers, a technician coming on shift can see at a glance whether any ISP your clients depend on is having a problem, before the first ticket arrives.
Your clients' service providers appear on the status page alongside Microsoft 365 and Google Workspace, and one click takes you from any monitored service to its monitoring settings and uptime heat map.
Reporting
A heat map of results over time, a per-client summary of issues, and a full export.
Share with your clients
Let a client see the whole checklist, only the checks that apply to them, or nothing. Clients can fill in their own checks.
Permissions
Control who can fill in checklists, who can change checks, and who chooses which clients each check covers.
Accessible by design
The checklist pages were reviewed against WCAG 2.2 Level AA. Everything works by keyboard and screen reader, and status is always shown in words as well as colour, so no one relies on colour alone to read a result. See our accessibility statement.
Frequently asked
- How are the checklists different from a shared document or spreadsheet?
- A document cannot see your fleet. Lavawall® checklists pull live data into each check from the same platform that runs your RMM and cloud monitoring, so a check about servers or Microsoft 365 already shows which clients have a problem and links straight to the detail. Every answer records who gave it and when, escalations collect in a follow-up view, and the results become part of the record your GRC and audit rely on.
- Can one check cover many clients?
- Yes. Give each client its own answer and comments, or cover everyone with a single answer. Choose all clients and new clients are included automatically, with inactive clients and prospects left out.
- What live data can a check show?
- Monitored services that are down, dashboard findings (computers not seen for 7, 30, or 90 days, antivirus, patches, low disk, Microsoft 365 and Google Workspace risks, security alerts, and more), live status and incidents from more than 50 service providers, and internet-provider outage status for major Canadian and US ISPs. Each number links straight to the details.
- Do we get alerted when a provider or ISP has an outage?
- Yes. You are notified when a provider or ISP you or your clients use reports an outage, the clients affected are named, and the alert closes on its own when the problem is resolved. You choose per provider whether alerts are automatic, always, or never.
- Are the checklists accessible?
- The checklist pages were reviewed against WCAG 2.2 Level AA. Everything works by keyboard and screen reader, and status is always shown in words as well as colour.