Summary Dashboard
One page that shows your whole security picture, from possible breaches and suspicious sign-ins to device problems, vulnerabilities and compliance.
What the page is for
The Summary Dashboard is the executive view of Lavawall. It brings the most important findings from every part of the product together, so you can see at a glance what needs attention and click straight through to fix it.
It covers cloud sign-in risks from Microsoft 365 and Google Workspace, alerts from the last seven days, device health from the Lavawall agent, vulnerability and PCI scan results, compliance progress and your internet-facing domains. Sections for services you have not connected stay hidden, and a Connect Services panel offers to set them up.
Choose one company in the company selector to see only that company, or all companies for an MSP-wide view.
What you see
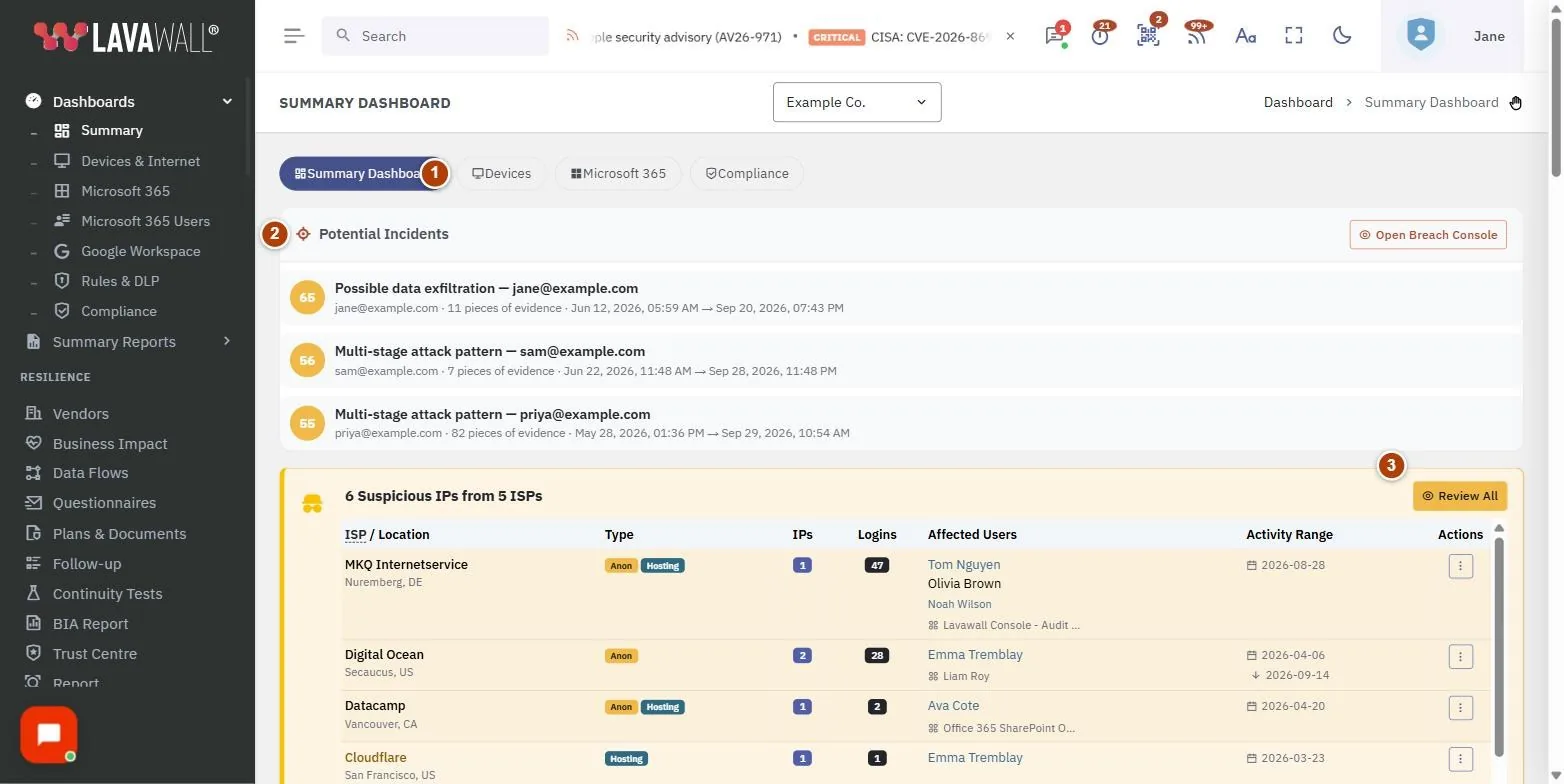
- Dashboard links: switch to Devices, Microsoft 365, Google Workspace or Compliance dashboards (the last three appear when connected or set up).
- Potential Incidents: up to five open possible breaches, each with a risk score, the affected user, the number of pieces of evidence and when it happened. Open Breach Console shows them all.
- Suspicious ISPs: successful sign-ins from VPN, Tor, hosting and data centre addresses, with ISP / Location, Type, IPs, Logins, Affected Users, Activity Range and Actions.
- Threat Hunting and Recent Alerts (7 Days): current threat-hunting findings and the last week's alerts. All Notifications opens the full list.
- Issues Requiring Attention: device problems such as AV Issues, Low Disk Space, High CPU, High Memory, Config Issues, Overheating, Restart Needed, Residential Connections, Bad Batteries, Aging Computers and Low Printer Supplies. Click one for the list of devices.
- Security panels: Ransomware Threat Hunter, Configuration Issues, Cloud Security (for example users without MFA or 2-step verification, risky OAuth apps, AI apps, new apps, external users, blocked logins and licence use), Login Activity (7 Days) and Top Missing Patches.
- Device Overview: Total Devices, Online Now, Patches Needed and Need Restart, with a Windows, Mac, Linux and server breakdown.
- Right-hand panels: Low Consumables, Internet Vulnerability, Vulnerability Scans (Critical, High, Medium, Hosts), PCI Compliance, Compliance, Device Locations, phishing reports, Replacement Priorities, Integrations and Connect Services.
How to use the Summary Dashboard
How to review a possible breach
- In Potential Incidents, click an incident.
- The breach console opens with that incident's details.
How to handle a suspicious sign-in location
- In Suspicious ISPs, click the ⋮ actions button on a row.
- Choose one of:
- Trust all IPs from this ISP or Trust just IP: adds the addresses to your Trusted IPs list and hides their signals.
- Mark signals reviewed (don't trust): clears the signals without trusting the address.
- Investigate ISP in M365 dashboard, View all logins from it, or Review all suspicious IPs.
- Confirm when asked.
How to see the devices behind an issue
- In Issues Requiring Attention, click a line such as Low Disk Space.
- Review the list of devices and open each one to fix it.
How to check vulnerabilities
- In Vulnerability Scans, click Critical, High, Medium or Hosts to see the matching findings.
- Click Full Report for the complete assessment.
How to connect a service
- In Connect Services, click the tile for the service, for example Microsoft 365, Google Workspace, Huntress, Sophos, Datto RMM, Domain Scan or PCI Compliance.
- Follow the sign-in or setup steps. Once connected, its panel appears on the dashboard.
Tips
- Incident risk scores are colour-coded: red for 70 and above, amber for 50 to 69, green below 50.
- Trust only addresses you recognize, such as your own company VPN. Trusting hides future signals from those addresses.
- Panels with findings may move higher on the page so problems are seen first.
- Expand the Device Locations map with its full-screen button.
- Only the services you have not connected yet appear under Connect Services, so an empty panel means you are fully set up.
Troubleshooting
- I only see Connect Services. Your account does not have permission to see device monitoring. Ask your administrator to change your role, or connect services from there.
- Potential Incidents or Suspicious ISPs is missing. These appear only when there is something to show and Microsoft 365 is connected.
- Microsoft 365 or Google Workspace links are missing from the top. Those links appear only once the service is connected for the selected company.
- A panel shows "Failed to load data". Reload the page. If it keeps happening, contact support.
Related articles
Still need help?
Search the support centre, or contact our support team and tell us which page you were on.
Names, companies, devices and figures in the pictures are examples. Other product and company names are trademarks of their respective owners.